error: 43 | 162 | Historical Market Data Service error message:Historical data request pacing violation
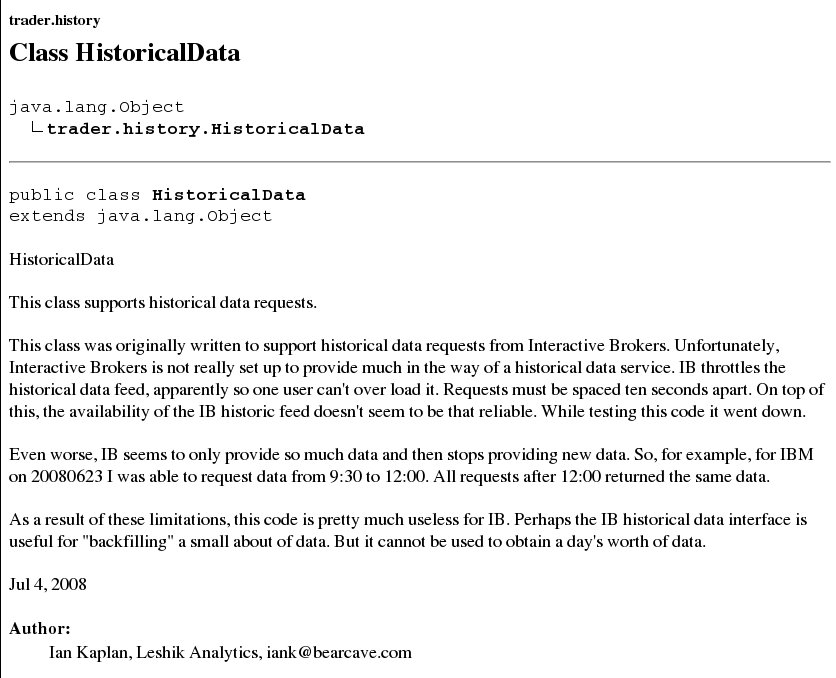
From the JavaDoc documentation for trader.history.HistoricalData.java (Java code written for an intra-day trading system):
The Interactive Brokers historical data feed seems to be structured to limit the amount of data returned in one request. Data can be requested in intervals of 1, 5, 15 and 30 seconds (as well as longer intervals). As the interval gets shorter the period of the request must decrease or you get an obscure error. Of course I have never seen any documentation that describes this constraint. The minimum resolution of 1 second can be obtained by making a data request of no more than 1800 seconds (30 minutes). One request could go from 10 AM to 10:30. A second request for 10:30 to 11:00. I was able to make a data request for April 7, 2008 so apparently it is possible to go back for a fairly sizable period. The data stream end is marked by a negative value for volume, count and price values. This allows the end of stream to be recognized so that another request can be sent.
An example of the data that is returned is shown below for Google. The data returned includes the open, high, low and close for the time period. I've averaged the high and the low here. The count is the number of data values that went into that region. Volume is the rounded number of 100 share lots.
With a little work it may be possible to use this data stream for historical back testing. The count gives the number of prices reported in the market. If there are 3 values and the average price is 579.76 the historical time series received from IB could expand to include {579.76, 579.76, 579.76} when the windowed moving average is built. We are using fairly long moving averages anyway (e.g., 100 ticks for the small window, 600 ticks for the long window). Even for Google, I'm not sure that using second resolution will make a lot of difference.
For a model that develops it trading signal from
D(t) = M100(t) - M600(t)
where M100(t) is the average over the last 100 values at tick t and M600(t) is the average over the last 600 price ticks at tick t. A price P(t) is associated with the difference of the averages D(t). The value D(t) is the value that we use to decide whether to place a buy. The value D(t) is going to move more slowly than the price, since it is a function of the moving averages. If there is a very short change, within a few ticks, for example, a price drop, and then a return to the previous price, we will only see a small change in the average price since the average has the "momentum" of its window. So the model doesn't seem that sensitive to tick resolution, at least at one second intervals.
If we're trading IBM and it's selling for 116.85 per share then we'll sell if the stock rises to 117.43 (a rise of 0.58). This should be visible at 1 second resolution. Given the transaction lag to the market I wonder if we can do much better than a second in any case.
Some IB Historical Data Examples:
IBM avgPrice = (low + high)/2

historicalData: 20080407  10:00:01 avgPrice = 116.85, count =  2, volume =  3
historicalData: 20080407  10:00:02 avgPrice = 116.84, count =  5, volume = 13
historicalData: 20080407  10:00:03 avgPrice = 116.83, count =  2, volume =  2
historicalData: 20080407  10:00:05 avgPrice = 116.85, count =  1, volume =  1
historicalData: 20080407  10:00:06 avgPrice = 116.84, count =  3, volume = 14
historicalData: 20080407  10:00:07 avgPrice = 116.84, count =  5, volume =  5
historicalData: 20080407  10:00:08 avgPrice = 116.85, count =  3, volume =  3
historicalData: 20080407  10:00:09 avgPrice = 116.87, count =  2, volume =  2
historicalData: 20080407  10:00:10 avgPrice = 116.87, count =  2, volume =  2
historicalData: 20080407  10:00:11 avgPrice = 116.89, count =  2, volume =  9
historicalData: 20080407  10:00:17 avgPrice = 116.88, count =  5, volume = 12
historicalData: 20080407  10:00:22 avgPrice = 116.87, count =  3, volume =  4
historicalData: 20080407  10:00:23 avgPrice = 116.89, count =  3, volume =  3
historicalData: 20080407  10:00:28 avgPrice = 116.88, count =  5, volume =  7
historicalData: 20080407  10:00:32 avgPrice = 116.88, count =  1, volume =  2
historicalData: 20080407  10:00:34 avgPrice = 116.88, count =  3, volume =  5
historicalData: 20080407  10:00:35 avgPrice = 116.86, count =  1, volume =  1
historicalData: 20080407  10:00:36 avgPrice = 116.84, count =  1, volume =  5
historicalData: 20080407  10:00:38 avgPrice = 116.84, count =  1, volume =  1
historicalData: 20080407  10:00:41 avgPrice = 116.87, count =  1, volume =  1
Google: avgPrice = (low + high)/2

historicalData: 20080512  10:00:00 avgPrice = 579.63, count =  6, volume =  7
historicalData: 20080512  10:00:02 avgPrice = 579.84, count =  1, volume =  3
historicalData: 20080512  10:00:14 avgPrice = 579.79, count =  1, volume =  1
historicalData: 20080512  10:00:15 avgPrice = 579.60, count =  1, volume =  1
historicalData: 20080512  10:00:17 avgPrice = 579.75, count =  1, volume =  1
historicalData: 20080512  10:00:23 avgPrice = 579.76, count =  3, volume = 11
historicalData: 20080512  10:00:25 avgPrice = 579.84, count =  1, volume =  1
historicalData: 20080512  10:00:33 avgPrice = 579.63, count =  2, volume =  2
historicalData: 20080512  10:00:34 avgPrice = 579.63, count =  2, volume =  2
historicalData: 20080512  10:00:35 avgPrice = 579.57, count =  3, volume =  3
historicalData: 20080512  10:00:36 avgPrice = 579.51, count =  1, volume =  2
historicalData: 20080512  10:00:40 avgPrice = 579.51, count =  1, volume =  1
historicalData: 20080512  10:00:41 avgPrice = 579.82, count =  1, volume =  1
historicalData: 20080512  10:00:43 avgPrice = 579.53, count =  3, volume =  5
historicalData: 20080512  10:01:00 avgPrice = 579.81, count =  2, volume =  3
historicalData: 20080512  10:01:02 avgPrice = 579.75, count =  1, volume =  1
historicalData: 20080512  10:01:04 avgPrice = 579.74, count =  4, volume =  4
historicalData: 20080512  10:01:06 avgPrice = 579.67, count =  1, volume =  1
historicalData: 20080512  10:01:12 avgPrice = 579.71, count =  2, volume =  2
historicalData: 20080512  10:01:15 avgPrice = 579.63, count =  2, volume =  2
historicalData: 20080512  10:01:26 avgPrice = 579.65, count =  2, volume =  3
historicalData: 20080512  10:01:29 avgPrice = 579.71, count =  1, volume =  2
historicalData: 20080512  10:01:44 avgPrice = 579.84, count =  1, volume =  1
historicalData: 20080512  10:01:46 avgPrice = 579.85, count =  2, volume =  2
historicalData: 20080512  10:01:47 avgPrice = 579.80, count =  2, volume =  3
historicalData: 20080512  10:01:55 avgPrice = 579.86, count =  1, volume =  1
historicalData: 20080512  10:01:56 avgPrice = 579.86, count =  1, volume =  1
historicalData: 20080512  10:02:14 avgPrice = 579.85, count =  3, volume =  3
historicalData: 20080512  10:02:23 avgPrice = 579.90, count =  1, volume =  1
historicalData: 20080512  10:02:32 avgPrice = 579.90, count =  1, volume =  1
The problem with IB is that most of their clients are small traders. Institutional accounts seem to be in the minority. The problem with having lots of individuals, instead of a smaller number of institutions is that the individuals can require just as much infrastructure without provides as much profit as the institution. A lot of the limitations that exist with IB seem to exist so that they can keep their infrastructure limited. This includes the consolidated market data and the limitations on historical data (e.g., requests must be spread out with a ten second lag).